SaaS Valuations: Part 1
Long story short: The revenue multiples we typically use to describe SaaS company valuations obscure a lot of information, particularly growth. Replicating those multiples using simple discounted cash flow valuations shows that growth rates have a large impact on valuation. So let’s not react to multiples without giving equal, if not more, weight to the assumptions about growth rates and their persistence. IF you believe the high growth rates, you believe the multiple—that’s mechanical.
Longer version:
The market isn’t crazy—at least not in the long-term. It tracks fundamentals (revenue, cash flows, capital invested, etc.).
Consider the following three perspectives:
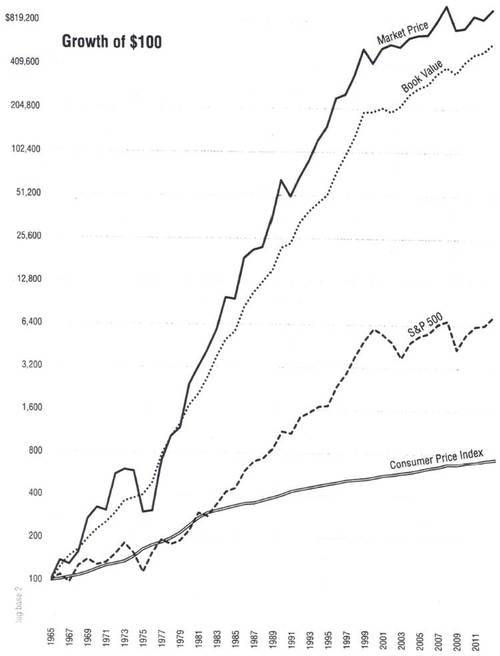
- Since taking over Berkshire Hathaway in 1965, Warren Buffett has focused consistently on growing book value per share in the belief that the company’s market value per share will track accordingly. That belief has proven to be pretty true:
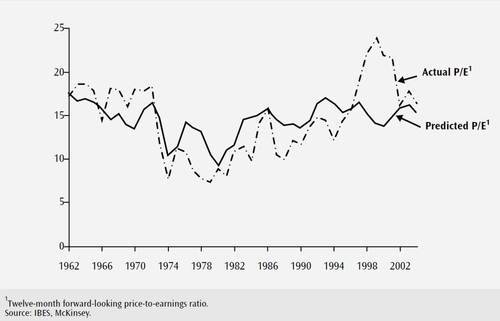
- In their popular book Valuation: Measuring and Managing the Value of Companies, McKinsey & Company described an analysis they did in which they estimated the earnings multiple of the stock market at specific points in time over a forty year period based on a forward-looking cash flow model. They compared the predicted price-to-earnings (P/E) multiple to the actual P/E multiple, drawing the chart below. They concluded: “Over the long term, the stock market as a whole appears to follow the simple, fundamental economic laws described in Chapter 3: Value is driven by returns on capital, growth, and—via the cost of capital—interest rates.”
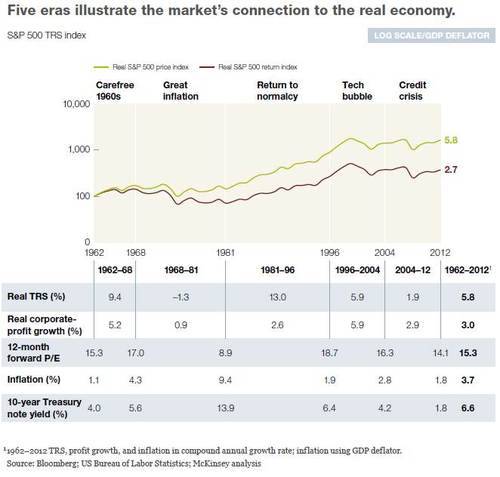
- A more recent study by McKinsey & Company tied different economic eras to stock returns. A nice (and deliberate) aspect of the descriptions is that they include eras long enough so that major drops in the stock market (e.g., the dot-com bubble and housing crash) are placed in proper context. Their conclusion was the same:
Unlike the market for fine art or exotic cars, where value is determined by changing investor tastes and fads, the stock market is underpinned by companies that generate real profits and cash flows. Most of the time, its performance can be explained by those profits, cash flows, and the behavior of inflation and interest rates. Deviations from those linkages, as in the tech bubble in 1999–2000 or the panic in 2009, tend to be short-lived.
So for SaaS companies…?
I liked McKinsey’s approach of replicating the multiples with discounted cash flows. It squared the circle, so to say, for me by explicitly tying the shorthand language of multiples to the more meaningful underlying assumptions about fundamentals.
I wondered: could you do the same for SaaS multiples? Could you describe a large part of the difference in multiples with simple assumptions?
Below are SaaS multiples for the most significant public SaaS companies:
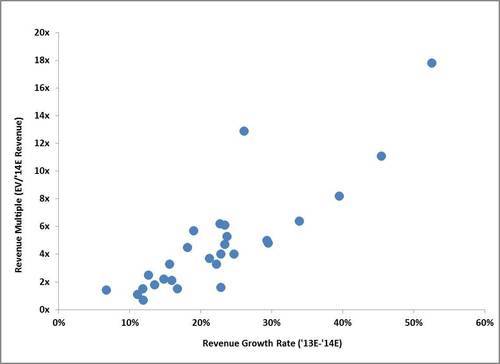
These are all the SaaS companies from Pacific Crest’s weekly Software Company Valuations distribution as of May 3, 2013. (I’ve included the specific distribution here. See page 2 for the SaaS companies, and their detail.)
The projected revenue growth rate from 2013 to 2014 is on the x axis, and the corresponding current enterprise value as a multiple of 2014 projected revenue is on the y axis.
(Those outliers at the top are NetSuite, to the left, and Workday, to the right—I’ll dive into what’s going on there in a later post.)
There’s a pretty clear relationship:
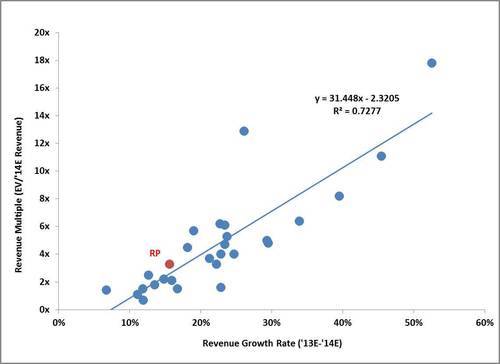
The red point is RealPage (RP), which is projected in the Pacific Crest document to grow at 16 percent and is trading at 3.3x 2014 projected revenue. Specifically, it has an enterprise value of $1.5 billion and projected 2014 revenue of $454 million.
I valued RealPage using a simple discounted cash flow, with the following assumptions:
- Revenue decay rate of 10 percent (i.e., revenue growth of 30 percent this year, 27 percent next year)
- Unlevered free cash flow margins of 20 percent
- Forecast period of 10 years
- Share count increase of about 2 percent each year
- Discount rate of about 12 percent
- Perpetual growth rate at the end of the ten year period of 2.5 percent
The resulting valuation is pretty close (RP*):

If you take that discounted cash flow analysis and just change the growth rates to reflect assumed ‘13 to ‘14 revenue growth rates of 10 to 50 percent and keep everything else the same, you get the following points and trend line (orange):
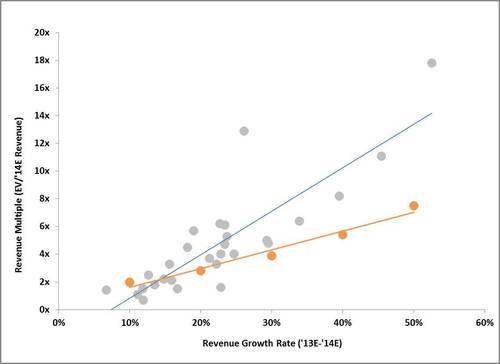
In other words, if you’re reasonably confident a company will grow its revenue 50 percent in 2014 and that it will see no more than 10 percent decay in that growth rate for the next ten years while sustaining 20 percent unlevered free cash flow margins, you’d be willing to pay 7.5 times 2014 projected revenue for that company.
And you’d only pay 2.8 times 2014 projected revenue for a similar company that would only grow revenue 20 percent in 2014.
That’s mechanical. Those assumptions are certainly arguable, but that’s not the point. The point is that the multiples tell you nothing. They just incorporate deeper—more meaningful—assumptions that do tell you something. Those assumptions at least you can debate, test, and research. Those assumptions and their robustness drive the valuation. Not the multiples. The multiples are just a summary.
In other words, a 7.5 times revenue valuation by itself doesn’t indicate a valuation that is expensive or cheap.
Now, let’s take those points and draw them again changing one assumption: revenue decay rate.
Let’s say, hypothetically, there were SaaS companies with very talented management, large revenue bases, high historic growth rates, great products, and proven development and sales capabilities attacking tremendously large markets with incumbents that were constrained by technology and legacy deployments from responding. And let’s say that for those reasons you believe those companies can sustain high growth rates for a long time horizon.
So let’s say instead of a 10 percent revenue decay rate you forecast a 5 percent revenue decay rate and keep the other assumptions above the same.
You get the red points and trend line:

Remove NetSuite and Workday, and you get this:
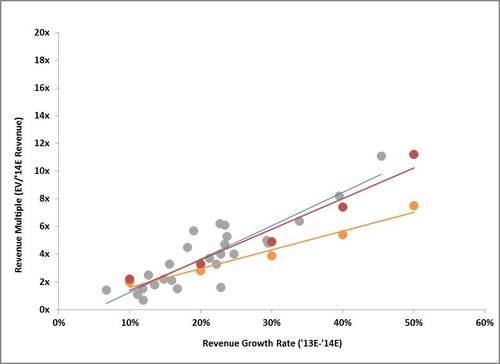
That’s a pretty good match.
Conclusion
My goal with the above is to make clearer the language we should use to think about SaaS valuations. Revenue multiples obscure too many assumptions.
At the highest level, they obscure the impact growth has on valuations. If you’re an investor for the long-term, buying these companies for the future cash flows they give you in return for your investment, the higher valuations as a function of higher growth rates are completely justified. If you believe the growth rates and other assumptions, you believe the multiple—that’s mechanical.
At deeper levels—operating margins, capex, discount rates, perpetual growth rates—this gives you a framework to work with. We know roughly the assumptions the market is pricing into the valuation of these companies. We can then determine where we differ.