Veeva is Different
I was reading Veeva's S-1 and recalled something I heard from Mike Maples. He pointed out that Microsoft raised $1 million of capital and that eBay raised $5 million (video). These huge, game-changing companies didn’t raise much capital. They created products for which, to quote Maples, “the world had a high give-a-shit factor”. The world needed their products badly, letting them fail, iterate, and improve, all the while begging them to continue to do business with them. And when these companies do get it right, their product gets pulled into the market.
After initially glancing through it’s S-1, I tweeted how remarkable it was that it raised only $7 million and was on track to clear $200 million of revenue, having doubled revenue consistently year after year.
Since sales and marketing tend to be the most significant use of capital in SaaS companies, I focused on that, and it appeared they performed far better in that dimension. In my tweet, I estimated they were about two to three times better than other SaaS companies.
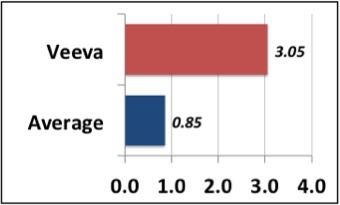
Turns out I was wrong. Veeva Systems was 3.6 times better than the average SaaS company. For every $1 they spent on sales and marketing, they generated $3.05 in annual recurring revenue. They made three times their money in just the first year. The average for all other currently public SaaS companies in their pre-IPO years was $0.85. These companies lost money in the first year, making it up in later years due to the subscription nature of the revenue.
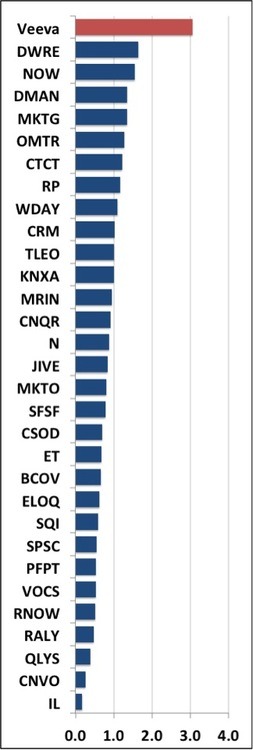
Digging one layer deeper, what’s remarkable is how far beyond the typical range Veeva Metrics is in this regard, standing out even from the second best-performing company, Demandware.
How does this happen?
I don’t have any proprietary insight today into how this came about, but there are hints in the S-1:
We sell our solutions through our direct sales organization and had sales representatives in 13 countries as of July 31, 2013. Our sales force is managed regionally by general managers in North America, Europe and Asia Pacific who are responsible for all sales, professional services and customer success in each of their geographies. We believe this provides for an integrated view of the customer relationship as well as higher levels of local and regional focus on our customers.
Life sciences companies are typically organized by the major functions of research and development for the creation and development of new solutions, and commercial, for the sales and marketing of those solutions once they are approved for use. In large life sciences companies, research and development and commercial business lines may also have separate technology and business decision makers. Accordingly, we market and sell our solutions to align with the distinct characteristics of the research and development buyer and the commercial buyer. Within each region, we have research and development and commercial sales teams. Each of these teams is further divided to sell to the largest global pharmaceutical companies and to smaller life sciences companies.
We believe the combination of our industry focus and commitment to customer success provides strategic advantage and allows us to more efficiently market and sell our solutions as compared to horizontal cloudbased companies. Our awareness, demand generation and sales cultivation programs are focused and designed to be cost efficient because we target only the life sciences industry buyers. We believe that we further benefit from word of mouth marketing as customers endorse our solutions to their industry peers. This allows us to focus our sales and marketing efforts without the need for a larger number of sales executives.
(Emphasis mine.)
In short, the company is sub-divided into regions with general managers seemingly running mini organizations targeting the companies in their regions. One person owns sales, professional services, and customer success. It’s a powerful alignment.
Combine that with the industry focus, where dramatic success with a few clients will spread through word-of-mouth, and it isn’t hard to imagine inbound requests flooding into the organization.
Professional services drove customer success
Professional services is something else that jumps out in the S-1. Veeva spent an incredible amount on professional services. Professional services was 50 percent of its revenue in early years, declining to 30 percent more recently. It was probably even higher in the years not detailed in the S-1. This was really low margin, difficult-to-manage and -scale business. They spent $50 million on professional services between 2009 and 2013.
Customer success drove very high renewal and upsell rates
Professional services drove customer success and had a powerful impact on future revenue from those customers. This is demonstrated in its churn metrics, what Veeva Systems measures as its renewal rates.
At the end of each year, Veeva Systems would take the total annualized revenue from the full list of customers at the end of the prior year and divide by the annualized revenue from those customers at the end of that prior year.
If some customers left and others spent about the same, this metric would be below 100 percent.
If, on the other hand, customers were not only sticking around but buying more from Veeva Systems, renewal rates would be above 100 percent.
For 2010, 2011, and 2012, renewal rates were 192, 159, and 187 percent, respectively. Specifically, on average across all customers that were customers at the end of 2011, for every $100 of subscription revenue, they had increased that to $187 by the end of 2012.
Having seen many such metrics for SaaS companies, I know these are amazing, particularly at the revenue levels to which they apply. Such an organic uplift from the established revenue base makes for very efficient sales and marketing because that revenue required almost no additional work.
Update: Subsequent to writing this post, David Skok and Pacific Crest put together a great survey of private SaaS company metrics, one of which has renewal rates as measured by Veeva here. It further illustrates how unusually high Veeva’s net renewal rates are compared the median 110 percent below:
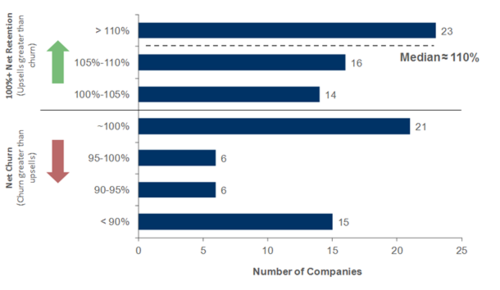
Further, I suspect this is skewed higher by companies with smaller revenue bases. For other metrics, David Skok and Pacific Crest separated those, finding a skew towards the high end, driven by the lower revenue companies. I’m confident that Veeva’s performance here is mind-blowing for any company with more than, say, $10 million in annual recurring revenue.
__
Notes:
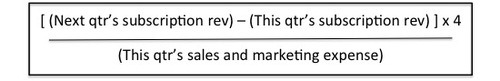
1. The exact calculation I used to assess sales and marketing effectiveness is below. I calculated this for every quarter highlighted in the S-1 of every SaaS company that went public, whether currently public or acquired. I then averaged the quarterly metrics to come up with one metric per company to estimate pre-IPO sales and marketing effectiveness.
2. I’d be remiss if I didn’t mention the folks from whom I learned this. They include Rory O’ Driscoll at Scale Venture Partners in a series of insightful posts on what he calls the Magic Number here and here, Phillippe Botteri when he was with Bessemer Venture Partners writing about CAC ratio here, and David Skok at Matrix Partners in a tremendous series on SaaS metrics here.
3. One thing worth commenting on is that Veeva Systems is built on top of Salesforce’s Force.com platform. This isn’t free. Salesforce gets a cut. I don’t know the exact arrangement, and I didn’t see it outlined specifically in the S-1. But it’s embedded in the gross margins, which, while lower than other SaaS companies, aren’t dramatically lower. Veeva’s 2012 gross margin on subscription revenue was about 75 percent. SaaS companies will ideally have 90 percent subscription gross margins. So this is significant. But it’s not 50 percent, which would be eye opening. So Botteri’s CAC ratio approach above, which uses GMs instead of revenue, would be one way to refine this. Back of the envelope adjustments indicate, however, that you’d still find Veeva Systems holding a significant lead in the areas I explored so I don’t think this changes my conclusions.